How to Track Scalable Link Building Performance
How to Track Scalable Link Building Performance
Scalable link building focuses on efficiently acquiring high-quality backlinks through automation, making tracking performance essential. Here's what you need to know:
- Why Track Performance? To connect SEO efforts to revenue and identify effective strategies. Pages ranking #1 on Google have 3.8x more backlinks than lower-ranking pages, while 95% of pages have none.
- Metrics to Monitor: Domain Authority, link velocity (growth rate of backlinks), referral traffic, and keyword rankings.
- Tools to Use: Platforms like GA4 and Linkzy simplify tracking by offering analytics on traffic, link quality, and performance.
- Steps to Start:
- Configure tools like GA4 and GSC for data collection.
- Organize link data using spreadsheets or dashboards for clarity.
- Establish baseline metrics like Domain Rating and total referring domains.
- Key Performance Indicators (KPIs): Monitor keyword rankings, traffic growth from backlinks, and link velocity to measure campaign success.
- ROI Measurement: Calculate ROI by comparing the revenue generated from organic traffic with link-building costs. Use tools like Looker Studio for detailed reporting.
Link Velocity: How Fast can you Build Links? [Webinar]
sbb-itb-0f47b19
Setting Up Your Link Tracking System
Link Building Performance Tracking System Setup Guide
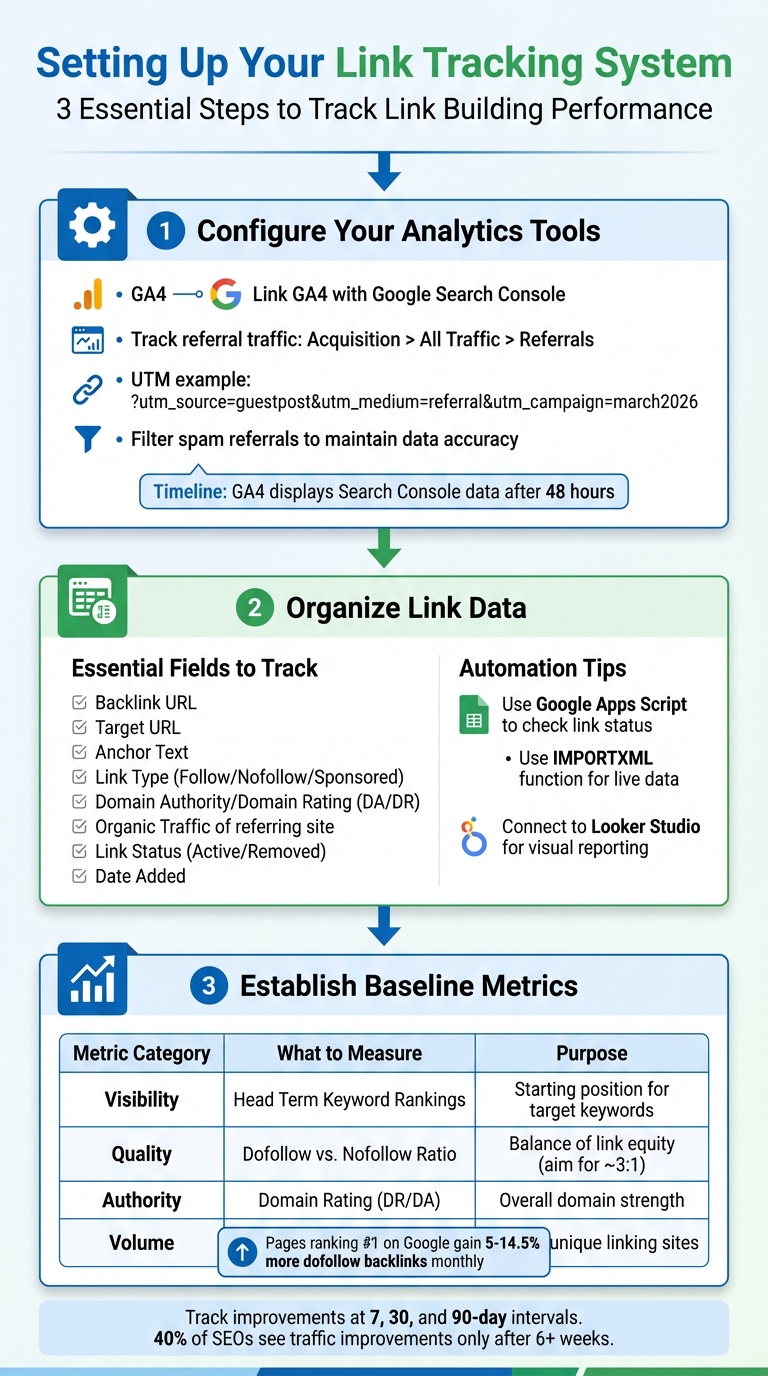
Before diving into measuring performance, it’s crucial to build a strong foundation for collecting and organizing your data. This involves ensuring your tools are properly configured, structuring your data effectively, and setting a clear starting point. Without these steps, you risk misinterpreting the information you gather.
1.1: Configure Your Analytics and Tracking Tools
Start by linking GA4 with GSC to track how search queries drive clicks and understand visitor behavior on your site. To do this in GA4, go to Admin > Product links > Search Console Links, select your property and web data stream, and confirm the connection. Keep in mind that GA4 takes about 48 hours to display Search Console data [7].
In GA4, referral traffic can be tracked under Acquisition > All Traffic > Referrals. Using UTM parameters like ?utm_source=guestpost&utm_medium=referral&utm_campaign=march2026 can help you directly monitor conversions [9][10][11][13].
For those using Linkzy, setup is straightforward. Once you’ve selected your niche, integrate the tracking snippet into your site’s header. If you’re on WordPress, plugins like "GA Google Analytics" can simplify this process by eliminating the need for manual code edits [11]. Linkzy’s dashboard provides real-time updates on which backlinks are active, their context, and their performance - removing the hassle of manual spreadsheet updates.
Don’t overlook this step: filter spam referrals in GA4. Ghost referrals and spam domains can distort your data, making it seem like you’re getting traffic when you’re not. Setting up filters from the outset ensures your reports stay accurate [10].
1.2: Organize Link Data with Spreadsheets and Dashboards
Even with automated tools, having a centralized tracking spreadsheet ensures easy access to your data. Your master sheet should include fields like:
- Backlink URL
- Target URL
- Anchor Text
- Link Type (Follow/Nofollow/Sponsored)
- Domain Authority or Domain Rating (DA/DR)
- Organic Traffic of the referring site
- Link Status (Active/Removed)
- Date Added [9][8]
To streamline updates, use Google Apps Script to check if links remain live. A simple script can scan the source URL to confirm if your target URL is still in the HTML, updating the status column automatically [8]. Alternatively, the IMPORTXML function can pull live data, such as page titles, with commands like =IMPORTXML(A2,"//title") [14].
For visual reporting, connect your Google Sheet to Looker Studio. This allows you to combine backlink data with traffic metrics from GA4, creating dashboards that display link velocity, authority distribution, and even toxicity scores [12]. If you prefer working within Sheets, the QUERY function can help filter data, such as showing only links with a DR above 70, without manually sorting rows [14].
"A custom Google Sheet offers flexibility and can be combined with other data sources at no cost." - Ralf van Veen, Senior SEO Specialist [8]
Linkzy simplifies this further by consolidating link data in its analytics dashboard. You can export reports or integrate them with your spreadsheets, but the platform handles tracking placement, status, and performance metrics automatically. With your data organized, you’re ready to establish baseline metrics.
1.3: Establish Your Baseline Metrics
Before starting a campaign, document your Domain Rating (DR), total referring domains, and current organic traffic levels [9][15]. These benchmarks will serve as your reference points for measuring progress.
"You should also establish a baseline for your backlink profile before initiating any link-building campaigns. This baseline will be a reference point for future analysis and enable you to contextualize changes and progress over time." [9]
Track your head term keyword rankings to monitor visibility improvements, and note your current dofollow-to-nofollow ratio to gauge how much "link juice" you’re receiving [1][16]. It’s also helpful to analyze competitors’ metrics - record the average Domain Authority and link velocity of the top 3–5 sites in your niche to set realistic goals [1][16].
| Metric Category | Specific Metric to Baseline | Purpose |
|---|---|---|
| Visibility | Head Term Keyword Rankings | Establishes starting position for primary target keywords [1] |
| Quality | Dofollow vs. Nofollow Ratio | Identifies current balance of link equity passing vs. non-passing links [16] |
| Authority | Domain Rating (DR) / Domain Authority (DA) | Measures overall domain strength before campaign launch [9] |
| Volume | Total Referring Domains | Provides count of unique sites linking to you [15] |
These metrics will guide you in tracking improvements in visibility and authority over time. Keep in mind that link velocity plays a key role. Research shows that pages ranking #1 on Google often gain between 5% and 14.5% more dofollow backlinks every month [3]. However, a sudden spike in backlinks can raise red flags, so focus on consistent, gradual growth [3][16]. Your baseline metrics will help you ensure your link-building efforts stay on the right track.
Tracking Key Performance Indicators
Once you've set up your tracking system, the next step is to focus on KPIs (Key Performance Indicators) that align with your campaign goals. Unlike raw metrics, KPIs are tied to specific outcomes, such as boosting revenue or improving search engine rankings, rather than just tracking numbers like total backlinks [17]. These indicators help you measure progress and make adjustments as needed.
"Link building is a key lever in any holistic SEO strategy and so the ultimate KPI for links is to drive revenue via organic performance."
It’s essential to evaluate performance at different intervals - 7 days, 30 days, and 90 days - to differentiate between short-term changes and long-term trends. Research suggests that about 40% of SEOs see traffic improvements from link-building efforts only after six weeks or more [5]. While patience is important, regular monitoring allows you to catch issues early and capitalize on successful strategies. Below, we’ll explore how to track specific KPIs tied to these goals.
2.1: Monitor Keyword Ranking Changes
Tracking keyword rankings is one of the most straightforward ways to assess the impact of your link-building efforts. Progress is measured by comparing your current keyword positions to previous ones [18]. For instance, if a target keyword improves from position 15 to position 8 within 30 days, that 7-position jump can often be attributed to your backlink strategy.
Monitor head term keywords weekly for immediate feedback, monthly for identifying trends, and quarterly for evaluating long-term progress. Tools like Google Search Console let you track keyword positions along with impressions and click-through rates. Interestingly, even a slight drop in ranking can sometimes result in more clicks if your snippet becomes more engaging.
To understand the impact of specific backlinks, compare keyword movement to the dates when links went live [3]. For example, if a high-quality backlink placed on March 15 results in a jump from position 12 to position 6, it’s a clear indicator of its effectiveness.
Platforms like Linkzy simplify this process by displaying active backlinks alongside their placement dates, making it easier to match ranking improvements with specific link acquisitions. Focus on consistent, gradual growth rather than sharp spikes, which could raise red flags with search engines.
2.2: Analyze Traffic Growth from Backlinks
Improving rankings is only beneficial if it leads to meaningful traffic. In GA4, navigate to Acquisition > All Traffic > Referrals to identify the domains driving traffic to your site. Use date filters to align traffic data with your link-building campaigns and pinpoint their impact.
Adding UTM parameters (e.g., ?utm_source=industrysite&utm_medium=referral&utm_campaign=april2026) to your backlinks allows you to track clicks, session duration, and conversions [1] [5]. For example, a backlink that delivers 500 visitors with a high bounce rate is less effective than one that brings 100 engaged visitors who spend significant time on your site.
Evaluate both the direct referral traffic from the backlink and any subsequent organic growth on your target pages. A strong backlink not only drives immediate traffic but also boosts page authority, which can improve organic visibility over time. With GA4’s Exploration feature, you can create custom reports to compare traffic trends before and after key link placements.
For users of Linkzy, the platform consolidates this data, showing which backlinks generate the most engagement. Reports can be exported or integrated with GA4 for a complete view. Studies reveal that traffic growth from link-building campaigns typically becomes evident within 1–3 months [1].
2.3: Assess Link Velocity and Quality
Link velocity, or the rate at which you acquire new backlinks, plays a critical role in maintaining a natural backlink profile. For new websites, a 10–15% monthly increase in referring domains is typical, while established sites often see growth rates of 3–5% per month [2]. To calculate your growth rate, use the formula: (New Referring Domains ÷ Previous Total) × 100 [2].
Be cautious about sudden spikes in link acquisition. For example, if your site typically gains 5 new links per month but suddenly adds 50 in a week, search engines might view this as suspicious. Tools like Linkzy help by scheduling link placements to ensure steady, natural growth.
When evaluating link quality, go beyond metrics like Domain Authority. Since there’s no automated tool for relevance scoring, manually categorize backlinks as high, medium, or low relevance based on their alignment with your niche [1]. Links from websites that are closely related to your industry often outperform those from high-authority sites lacking contextual relevance [3].
| Quality Factor | What to Check | Why It Matters |
|---|---|---|
| Niche Relevance | Does the linking site cover your industry? | Relevant links carry more weight in rankings [3]. |
| Referral Traffic | Does the linking page attract real visitors? | Pages with active traffic provide genuine engagement [16]. |
| Dofollow Ratio | Is the dofollow:nofollow ratio balanced? | A natural ratio (around 3:1) avoids penalties [16]. |
| Anchor Text Distribution | Are anchor texts varied and natural? | Balanced anchor texts reduce algorithmic risks [2]. |
Perform monthly audits to identify lost or broken links, as valuable backlinks can disappear due to site updates or redesigns [19]. Reaching out to webmasters can often restore these links. Linkzy’s dashboard tracks link status and sends alerts when a previously active backlink goes offline.
"In the modern SEO landscape, what you can't measure, you can't improve. Metrics aren't just numbers - they're the language of strategic decision-making."
- Brandon King, Author [2]
Measuring ROI and Business Impact
Once you've tracked rankings and traffic, the next step is figuring out how your link-building efforts contribute to revenue. Interestingly, about 40% to 45% of marketers find it tough to measure the effectiveness of link-building campaigns [23]. To calculate ROI, use this formula:
ROI = ((Revenue from Links - Cost of Link Building) / Cost of Link Building) × 100 [23][24].
"Link building is often 40% of an SEO budget – sometimes more in competitive industries."
Unlike paid ads, which yield immediate results, backlinks take time to show their impact. Typically, you’ll see results within 3 to 6 months [25]. But the beauty of backlinks is their longevity - a single link can keep delivering value for years.
3.1: Track Conversions from Organic Traffic
To connect link-building efforts to revenue, start by tracking conversions through Google Analytics 4. Set up key events by navigating to Admin > Events > Mark as key event. Track actions like newsletter signups, demo requests, purchases, or contact form submissions - whichever align with your business goals [20][23].
Pay special attention to "money pages" - these are your product or service pages where link-building has a direct impact on revenue [22]. For example, if you built 10 backlinks to a service page in January and its conversion rate jumped from 2% to 3.5% by March, part of that success can be attributed to your link-building efforts.
"Link building is a key lever in any holistic SEO strategy and so the ultimate KPI for links is to drive revenue via organic performance."
- Laura Slingo, Outreach Manager, Sage [1]
To measure performance, calculate revenue per visit (RPV):
RPV = Total Revenue / Number of Visitors [20]. For instance, if your site generates $50,000 from 10,000 visitors, your RPV is $5. If a backlink campaign brings in 2,000 more visitors per month, that could translate to an additional $10,000 in revenue.
Use GA4's Referrals section to pinpoint which backlinks are driving conversions. Tools like Linkzy can also provide real-time insights, showing which links generate the most engagement and revenue, saving you from manually cross-referencing data.
3.2: Compare Campaign Costs to Performance Results
To assess profitability, you need a clear picture of total campaign costs. This includes internal expenses (like staff salaries and SEO tools), external costs (agency fees, freelancer payments, and paid placements), and content creation costs [21][25]. For example, if you spend $499 monthly on Linkzy, $200 on SEO tools, and allocate 10 staff hours at $50 per hour, your total monthly cost is $1,199.
Calculate the cost per acquired link (CPAL) with this formula:
CPAL = Total Campaign Cost ÷ Total Links [25]. If you spend $3,000 and secure 15 backlinks, your CPAL is $200.
Next, estimate the annual value of your target pages. Multiply the monthly search volume by the expected click-through rate (top organic positions usually get 27.6% to 33% of clicks [20]), the conversion rate, and the average lead or sale value [22][24]. For example:
5,000 searches × 0.30 CTR × 0.04 conversion rate × $200 per customer × 12 months = $144,000 annual page value.
"If your ROI drops below 100%, it's a signal that your current strategy needs adjustments - either by reducing costs or improving link quality and targeting."
- Srikar Srinivasula, Founder, OutreachZ [25]
Finally, calculate ROI using this formula:
ROI = (Annual Page Value – Link Building Cost) / Link Building Cost [22]. For example, if your annual page value is $144,000 and you spent $10,000 on link-building, your ROI is 1,340%.
Another metric to watch is traffic value, which estimates the cost-per-click (CPC) equivalent of your organic traffic [26]. For example, if your keywords would cost $8 per click in Google Ads and you’re getting 1,000 monthly clicks, that’s $8,000 in monthly value - or $96,000 annually. Tools like Ahrefs and SEMrush can calculate this for you, providing clear insight into your ROI.
3.3: Create ROI Dashboards
A well-designed dashboard makes it easier to communicate results and spot trends. Google Looker Studio is a free tool that integrates data from Google Sheets, GA4, and Search Console to create real-time ROI reports [1][26].
Organize your dashboard into three sections:
- Investment: Include monthly costs, CPAL, and total links acquired.
- Performance: Highlight organic traffic growth, keyword rankings, and referral conversions.
- Returns: Show revenue generated, ROI percentage, and traffic value.
Add a time-series chart that tracks organic traffic and revenue over the past 6–12 months. Annotate key moments, like when major link placements went live, to show how link-building ROI builds over time. For example, you might see a steady rise starting 6–8 weeks after a campaign launch.
Consider including a link tier breakdown table that segments backlinks by authority and shows the average ROI for each tier. This can help you identify which types of links are delivering the best returns.
| ROI Component | What to Include |
|---|---|
| Internal Costs | Staff salaries, SEO tools (Ahrefs, SEMrush), outreach software (Pitchbox, BuzzStream) [21][25] |
| External Costs | Agency retainers, freelancer fees, paid placements, content production [21][25] |
| Returns | Organic traffic growth, direct referral revenue, assisted conversions [21][23] |
For Linkzy users, the platform’s analytics can be exported directly into Looker Studio, streamlining your reporting process by eliminating the need to compile data from multiple sources.
Optimizing Your Link-Building Strategy
Tracking performance is essential to fine-tune your link-building efforts. Constantly evaluating and improving your approach can turn a static campaign into one that delivers long-term results. With that in mind, let’s explore how to refine and expand your strategy.
4.1: Identify Areas for Improvement
Start by analyzing your link velocity - the rate at which you’re acquiring backlinks. Use your dashboard to spot any unusual spikes or drops. For instance, gaining 30 links in January but only 3 in February could signal an issue with your outreach process. Sudden spikes might also appear unnatural to search engines, so aim for steady growth [4].
Next, assess your anchor text diversity. If over 20% of your anchor texts are exact-match keywords, you could face penalties [3]. A strong profile balances branded terms (e.g., "Linkzy"), naked URLs (https://yoursite.com), and generic phrases like "click here." Anchor text impacts about 35% of SEO ranking factors [4], so variety is essential.
Also, evaluate referral traffic and engagement metrics. A backlink from a high-authority site won’t help if visitors leave quickly.
"A link from a DR 60 pet blog won't help a fintech startup. Google places increasing importance on topical relevance."
- Vibhav Gaur, Business Head, Outreach Crayon [3]
Finally, review your CPAL metrics (cost per acquired link) to measure the efficiency of tactics like guest blogging, digital PR, or broken link building.
4.2: Scale Campaigns with Automation
Once you’ve identified what’s working, use automation to expand your efforts. Manual outreach has its limits, and automation can help you scale without sacrificing quality.
Start by automating prospect discovery and scoring. Tools can crawl search engine results, analyze competitor backlinks, and find broken links. AI-driven scoring then filters out poor matches, saving hours of manual work and ensuring you focus on the most relevant targets [6].
Adopt a tiered outreach strategy. For high-value prospects (like DR 70+ sites in your niche), use personalized, handcrafted emails referencing their content. For mid-tier opportunities, semi-customized templates can save time while maintaining a personal touch. For example, when reaching out to marketing blogs, use pre-written snippets that address shared challenges.
Automation can also manage repetitive tasks like data validation, contact retrieval, and follow-up scheduling. This frees your team to focus on strategy and building relationships. In fact, 70% of marketing leaders plan to increase spending on automation by 2025, with the market expected to hit $15.58 billion by 2030 [6].
Tools like Linkzy simplify this process by identifying relevant sites, placing contextual backlinks, and maintaining a natural link velocity.
"The craft is still human; automation manages repetitive tasks."
However, human oversight remains crucial. For high-authority or brand-sensitive sites, implement checkpoints to ensure quality stays high [6].
4.3: Conduct Regular Performance Audits
Once your campaigns are running smoothly, regular audits are key to staying on track. For most businesses, monthly reports strike a good balance between timely updates and actionable insights. High-velocity campaigns might require weekly reviews [4].
Use the metrics and dashboards you’ve already set up to evaluate four key areas:
- Acquisition: Track new backlinks, referring domains, and link velocity.
- Relevance: Check anchor text distribution and ensure topical alignment.
- Impact: Measure organic traffic, keyword rankings, and referral performance.
- Financial Performance: Monitor cost per link and ROI.
Audits can also help you spot link gaps - the difference between your backlink profile and that of top competitors [27]. For example, if a competitor has 51 more links and gains 15 monthly, you might need to acquire 20 links per month to close the gap within a year.
Additionally, audits allow you to reclaim lost value. Identify 404 errors on pages with backlinks and apply 301 redirects to recover link equity [28]. Scan for toxic links - those with a spam score above 30% or originating from hacked pages - and disavow them to protect your site’s reputation [5].
Finally, ensure that new backlinks are indexed by Google. A link only adds value if search engines recognize it. Use Google Search Console to monitor indexing status and follow up on any links that haven’t been crawled [5].
"Without reporting, you're guessing - and that's expensive... Insight = strategy. And strategy = ROI."
- Gary, Link Juice Club [5]
While the results of your efforts may take 1 to 3 months to become visible [1], regular audits ensure your strategy stays aligned with your goals and delivers measurable progress.
Conclusion
Turning tracking systems and KPIs into actionable strategies is the key to improving SEO performance. By setting up analytics tools, keeping an eye on metrics like keyword rankings and link velocity, and routinely auditing your backlink profile, you create a system that drives continuous improvement. Businesses that thrive in SEO treat link building as a precise, data-focused process - not a guessing game.
And the data backs this up: pages that rank at the top of Google typically have nearly 4x more backlinks than lower-ranking pages [5]. But it’s not just about volume - relevance and maintaining a natural link-building pace are just as important. A steady, consistent strategy not only builds authority but also helps avoid penalties from search engine algorithms.
This method ensures your efforts are both measurable and effective, paving the way for long-term success in SEO. Tools like Linkzy make scaling even easier, offering automated solutions to find niche-relevant sites and secure contextual backlinks on a natural schedule - all for just $19/month for 5 credits.
FAQs
How do I attribute ranking gains to specific backlinks?
To figure out how specific backlinks contribute to ranking improvements, you'll need to rely on tools and analytics to track their impact over time. Focus on key metrics such as referral traffic, domain authority, and backlink quality. For example, Google Analytics can help you monitor traffic coming from individual backlinks, giving you a clearer picture of their value.
Additionally, techniques like causal impact analysis and detailed backlink reports can shed light on which links are actively boosting your rankings. By combining these approaches, you'll gain a better understanding of how your backlinks are performing and which ones are making the biggest difference.
What does natural link velocity look like for my site?
Natural link velocity refers to the steady and gradual growth of backlinks over time, without any sudden surges or sharp declines. This could look like gaining a handful of links each month or maintaining a consistent rise in the number of referring domains. Google tends to prefer this type of steady growth, as it suggests authentic interest in your content. On the flip side, abrupt or unnatural spikes in backlinks could raise red flags and potentially lead to penalties. The goal should be to achieve a gradual increase that aligns with your site's content and the typical patterns within your industry.
How can I calculate link-building ROI in GA4?
To figure out the ROI of your link-building efforts in GA4, use this formula: [(Total revenue - marketing expenses) / marketing expenses] x 100%.
Start by tracking referral traffic, conversions, and any revenue that can be linked to your backlinks. Then, compare these results to the money spent on your link-building campaigns. This comparison gives you a clear picture of how effective your efforts are.
By analyzing referral traffic and key events in GA4, you can better understand how your link-building activities contribute to your business goals.